Screenshots (Aurora)
Activity RSRC
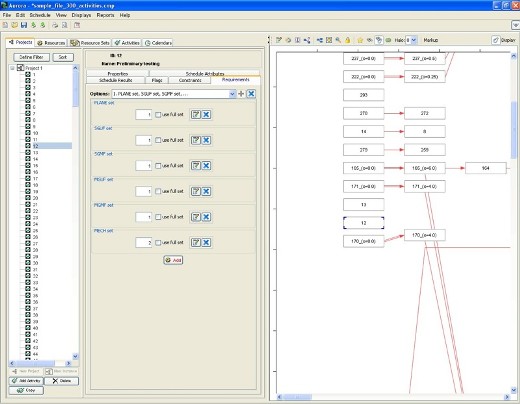
Pert Display
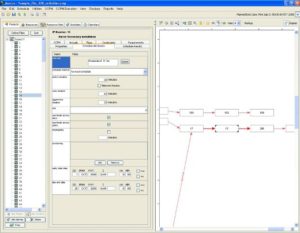
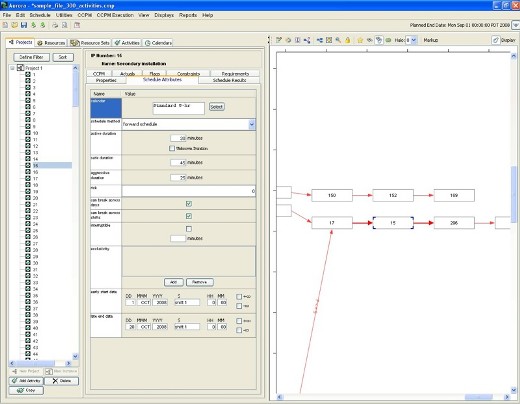
Schedulable Properties

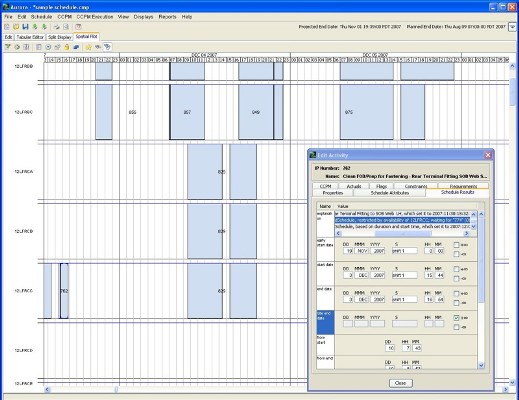
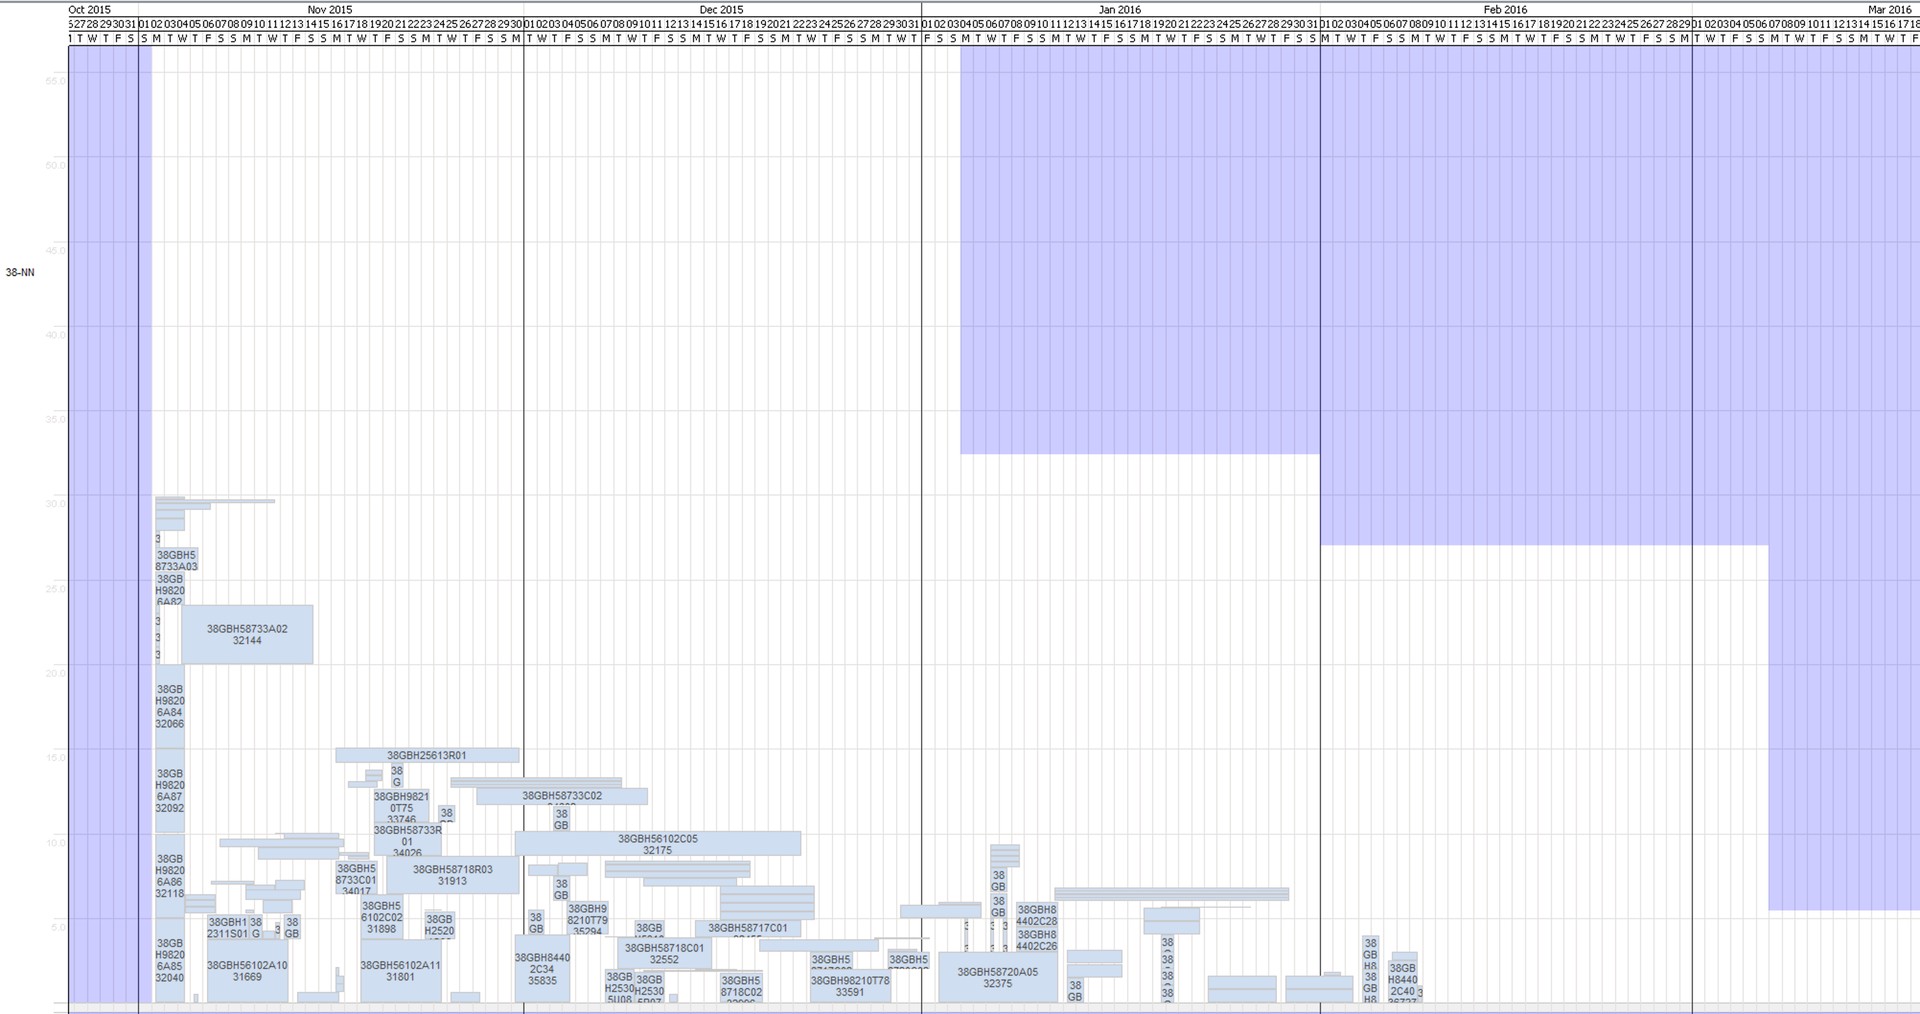
Spatial Plot

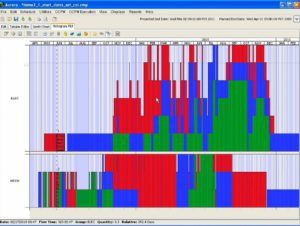
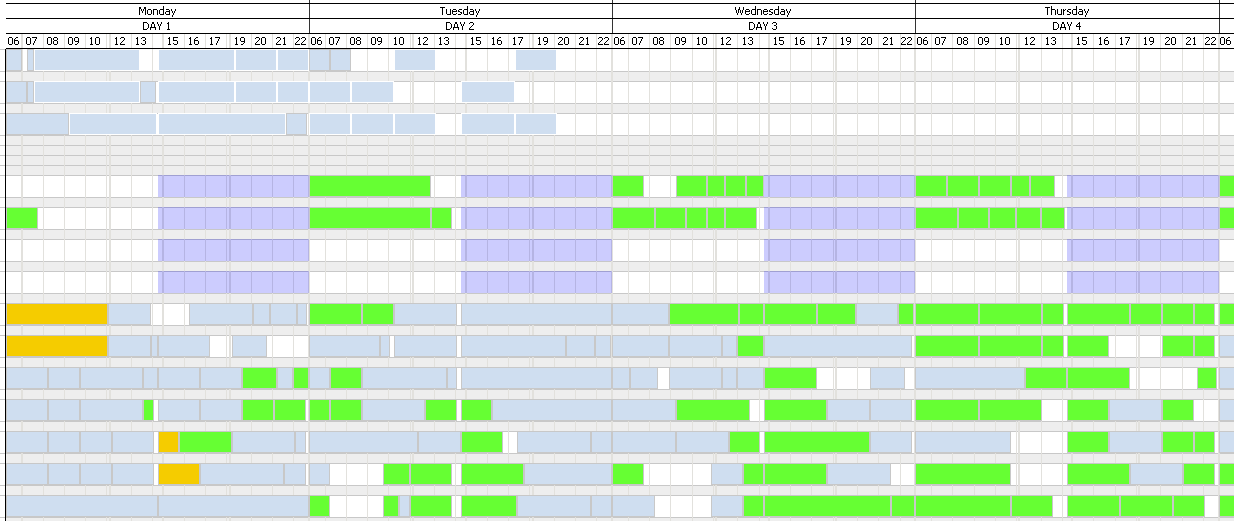
Gantt RSRC Plot view
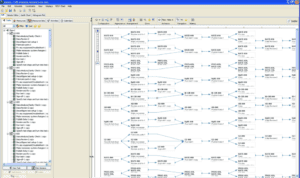
Multi-Project View
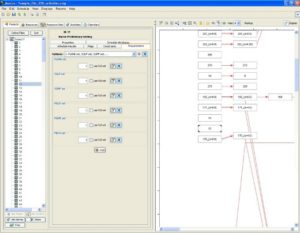
PERT Single Element Display
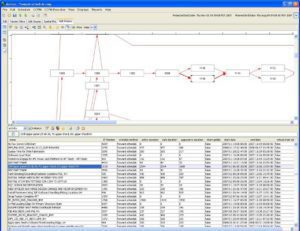
PERT Tabular Editor
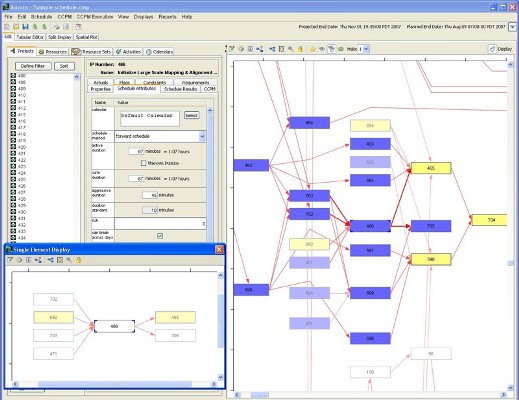
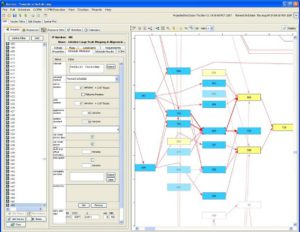
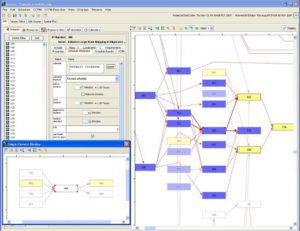
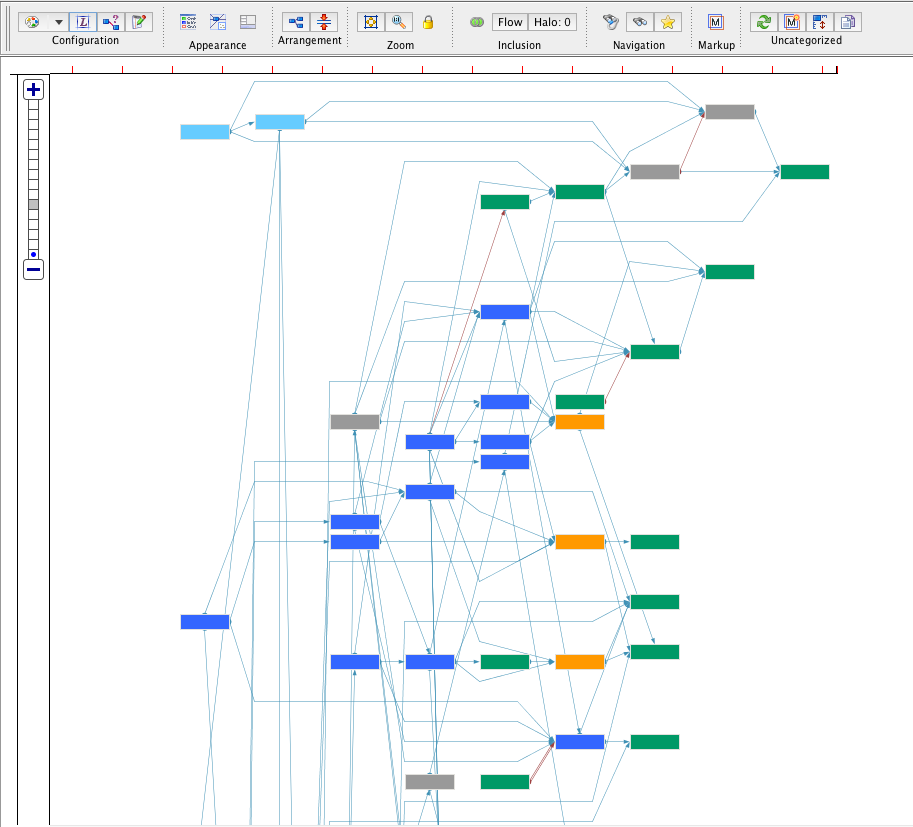
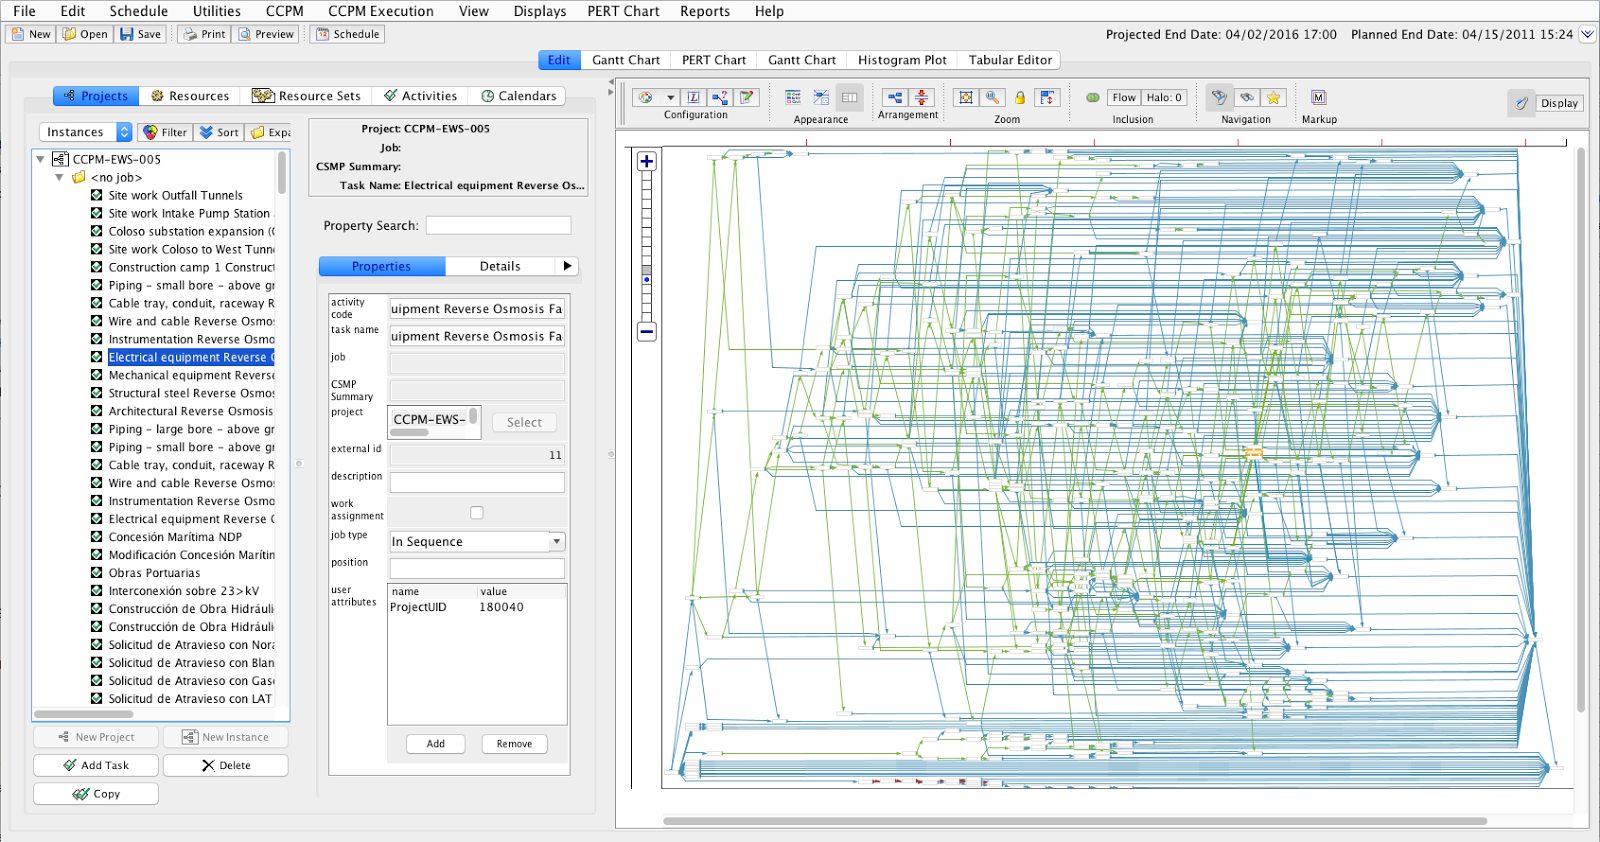
Main Display Showing Project Hierarchy Network Diagram

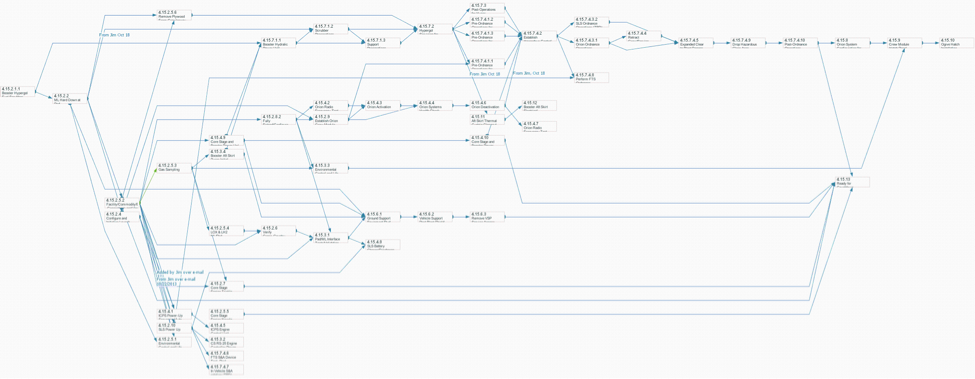
PERT Chart
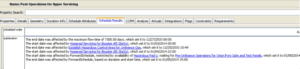
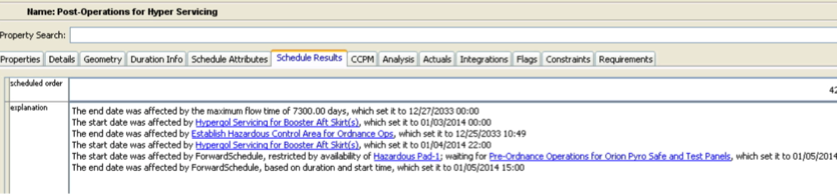
Automatically Generate Explanation for One Scheduled Activity
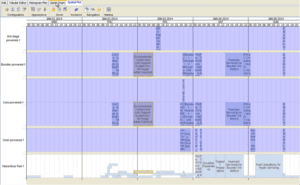
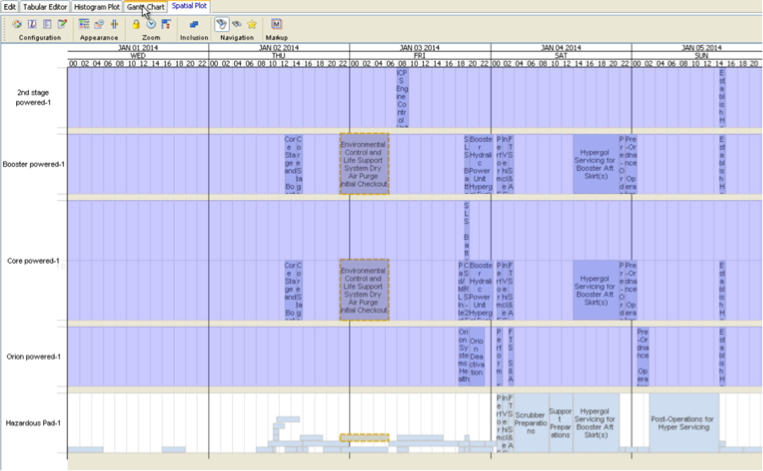
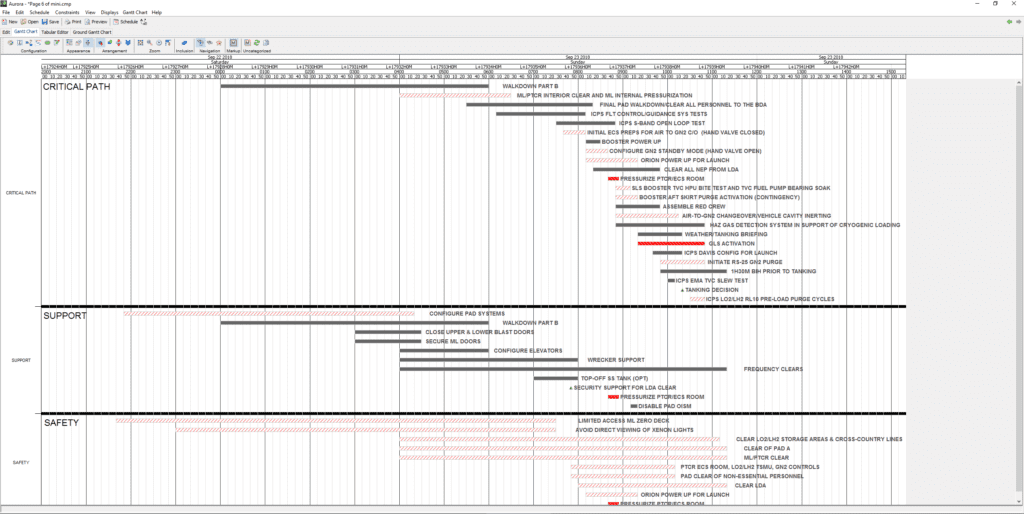
Resource-Activity Schedule Display, Including the Hazardous Pad Area
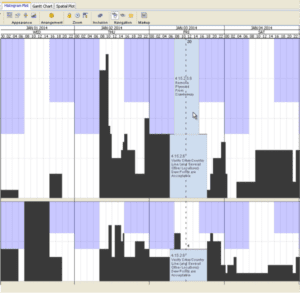
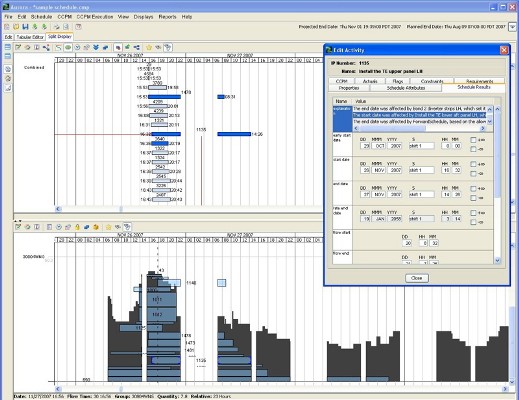
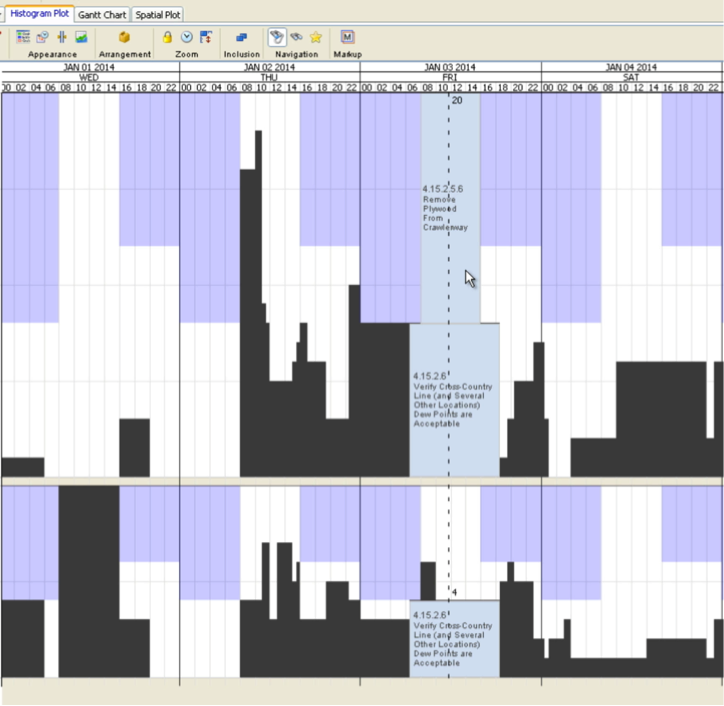
Manpower Histogram, Showing Activities Constituting Manpower Need for One Time Instance
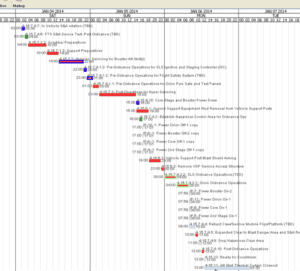
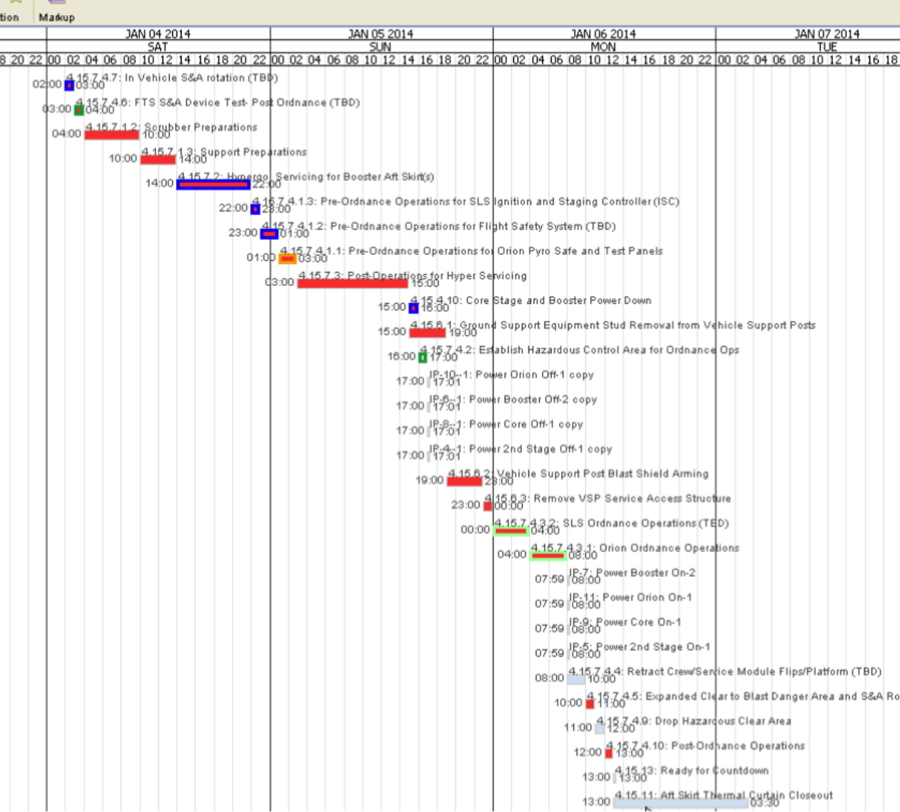
Gantt Chart with Color Coding by Properties
Network diagram, color coded by various criteria
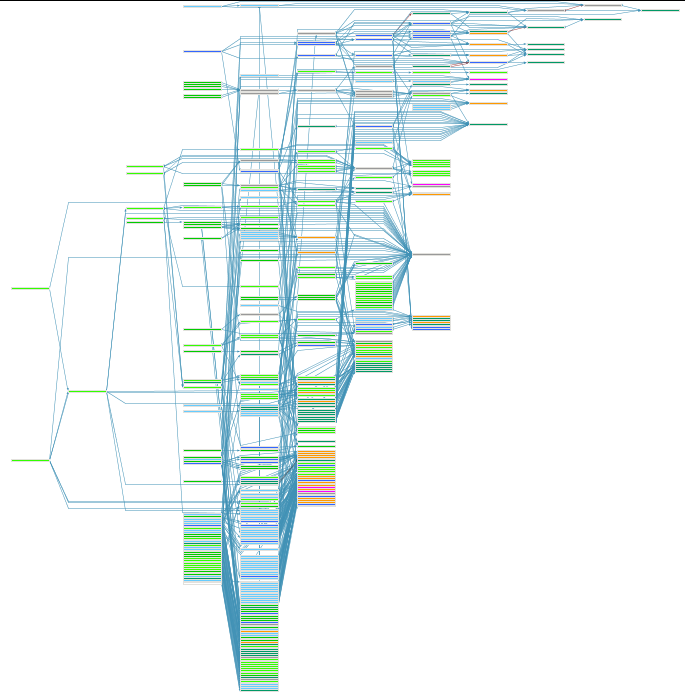
Network diagram, color coded by various criteria, zoomed out
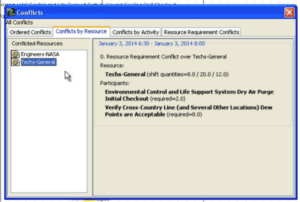
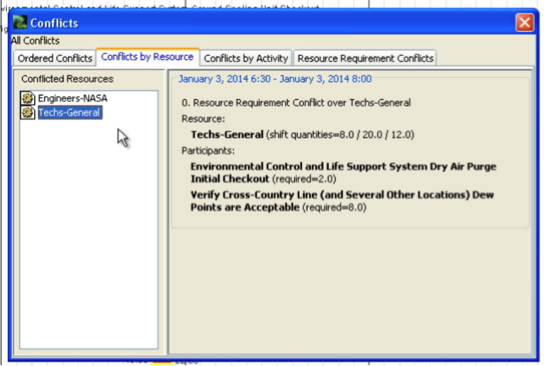
Conflict Report
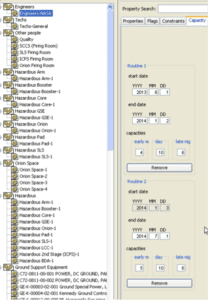
Resource Sets
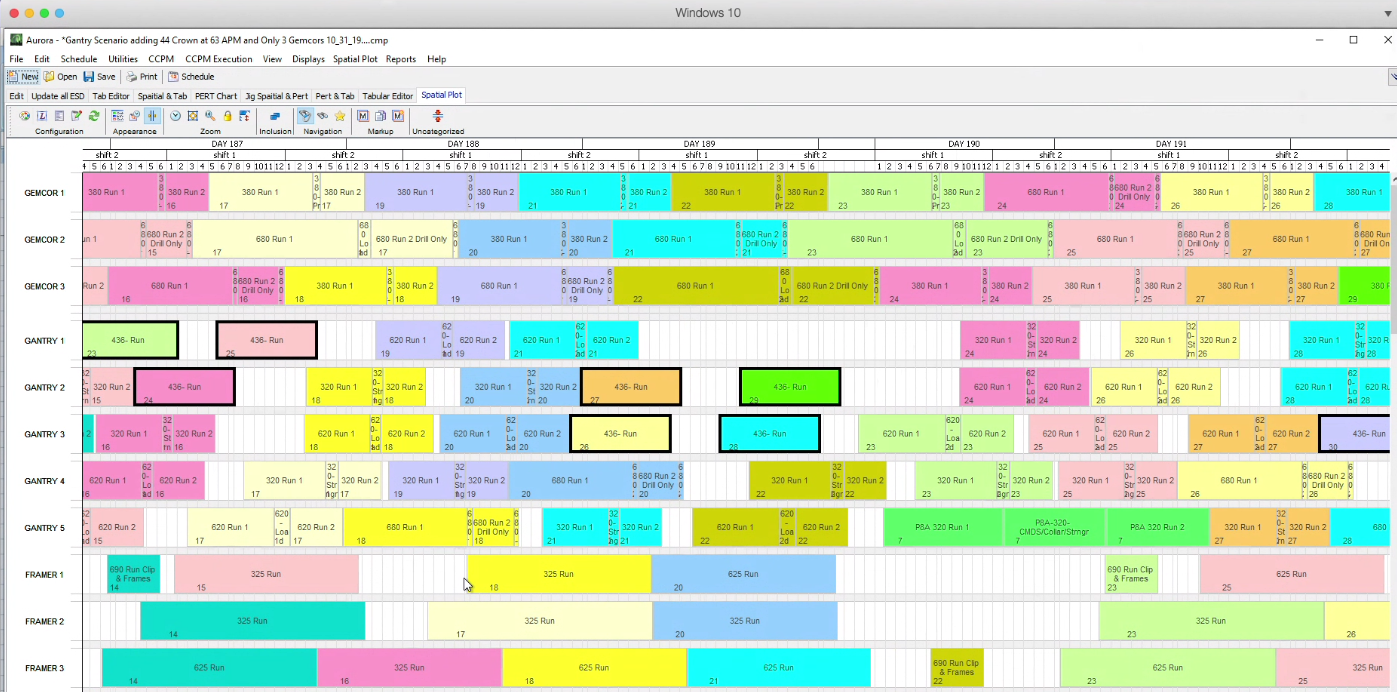
Spatial Plot, snapshot with criteria-based color coding
Gantt Chart with User Defined Formatting
Main Interface showing Different Constraint Types in Network Diagram
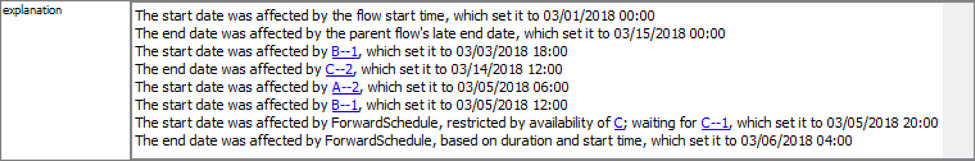
Automatically Generate Explanation: Influenced by Multiple Predecessors (last one listed is the predecessor driver)
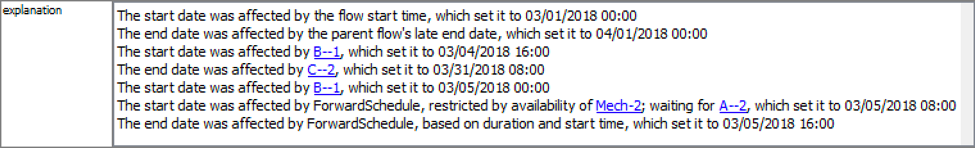
Automatically Generate Explanation: Influenced by Predecessors, Successors, Delay Waiting for Mechanic Resource
Resource-Activity Schedule Display,
with Overlapping Shifts

Multi-line resource allocation display
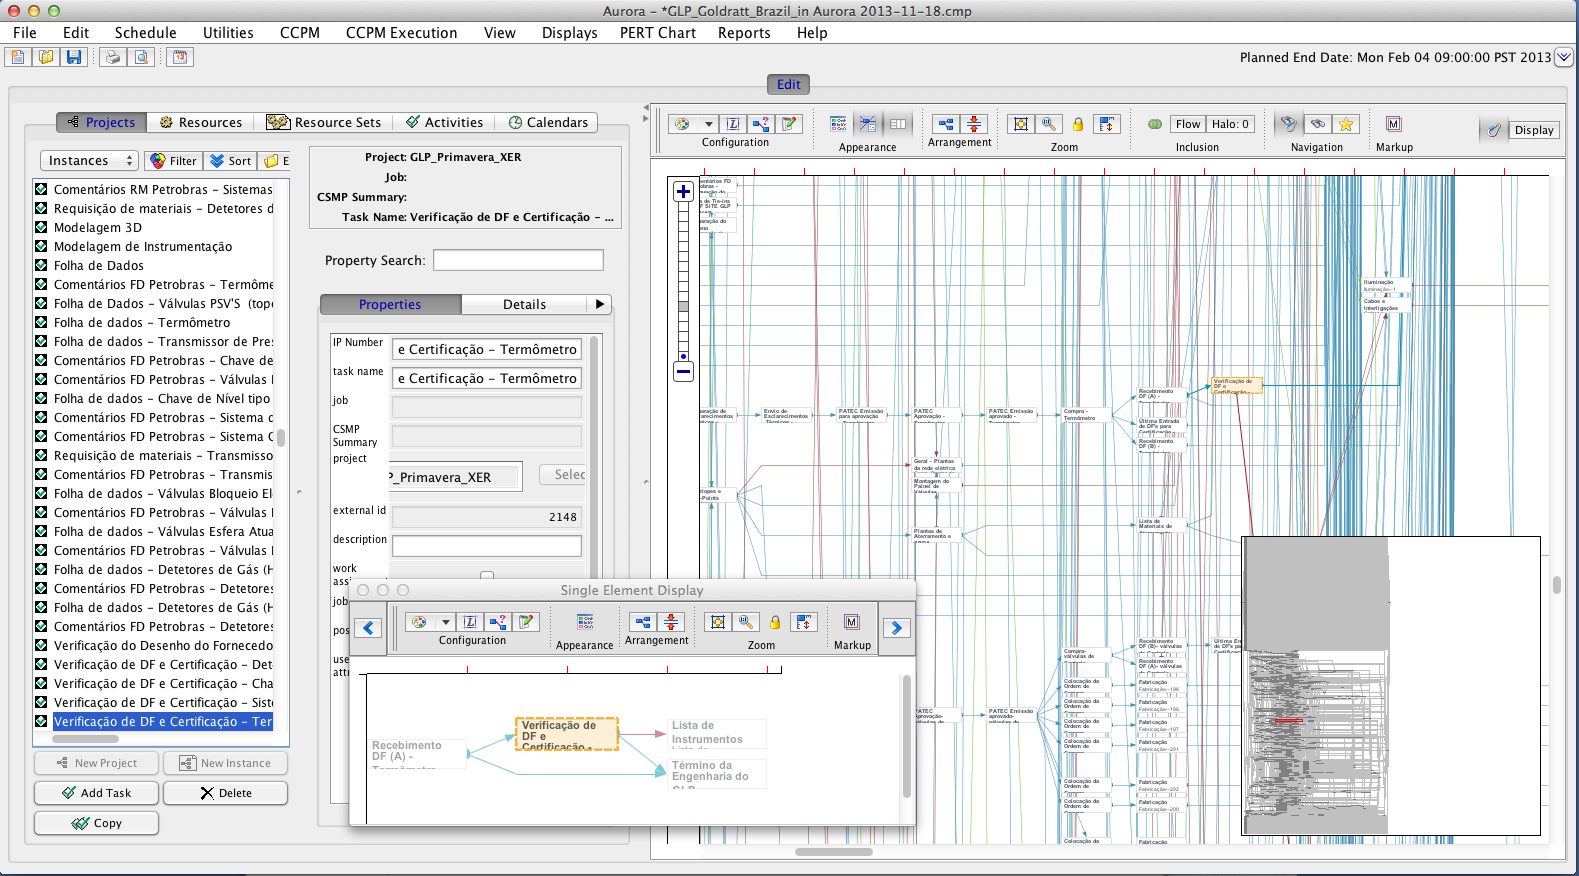
Main Interface with Single-Element View and Zoom Panel

Accumulation by Day Plot

Burndown by Day Plot