
Screenshots (Aurora-CCPM)
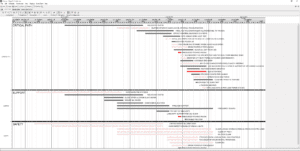
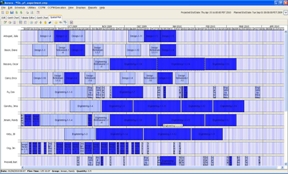
Gantt Chart with User Defined Formatting
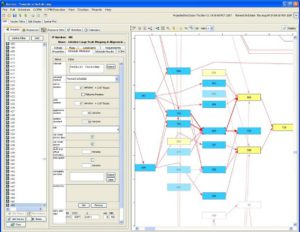
Main Display with color coded network diagram based on criteria
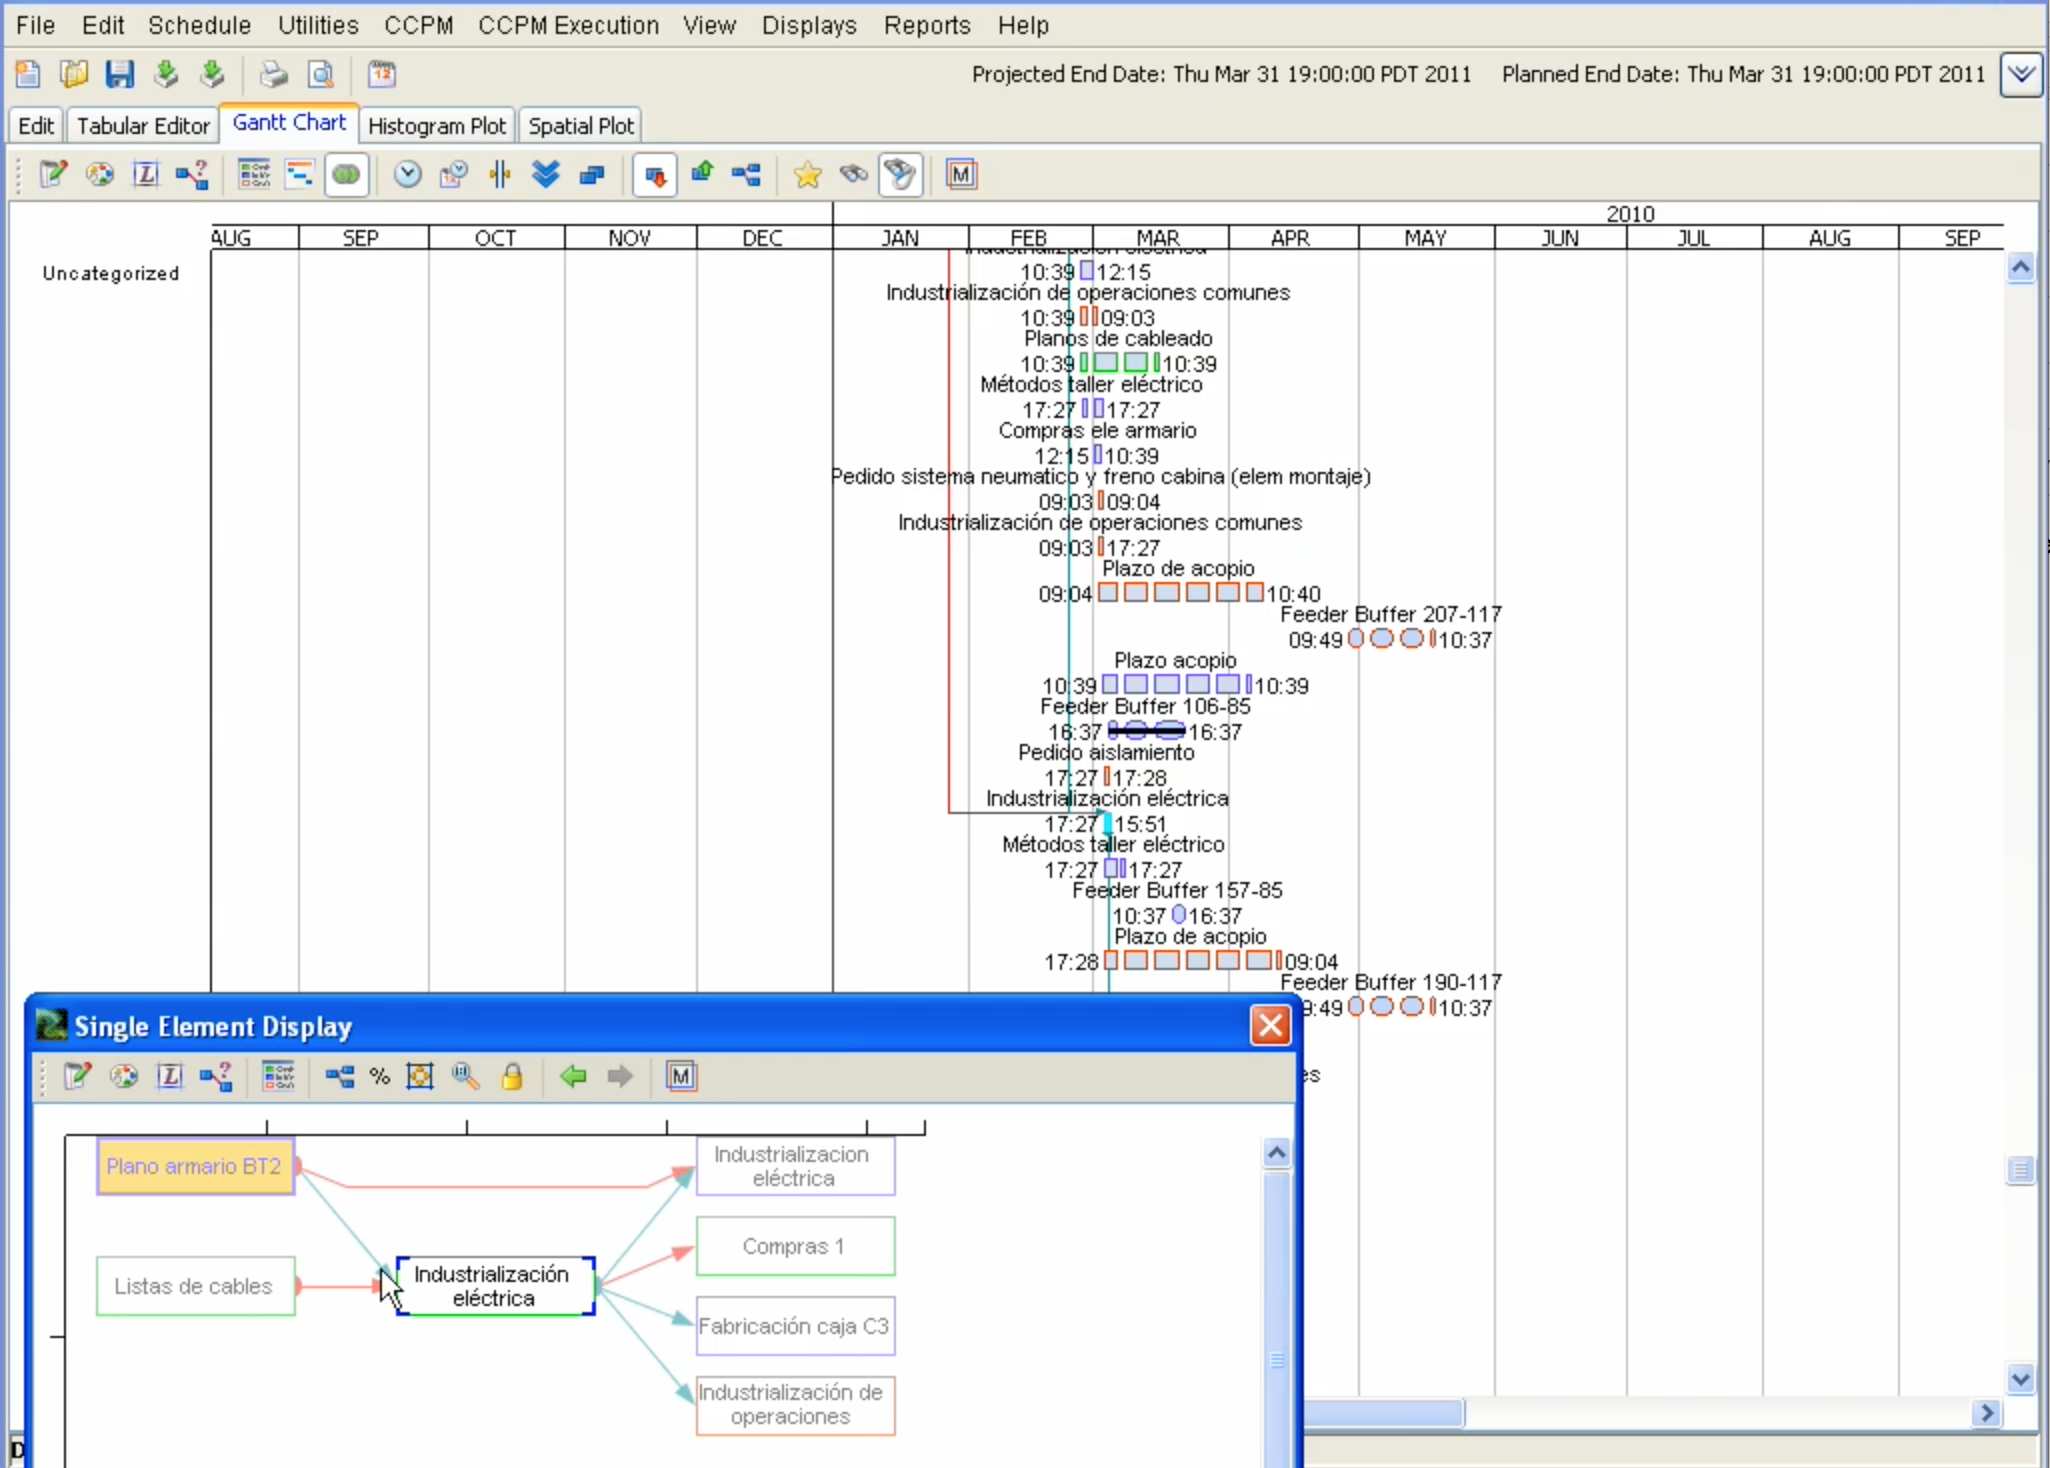
Gantt Chart showing color coding based on criteria, single-element view & note Feeder Buffer
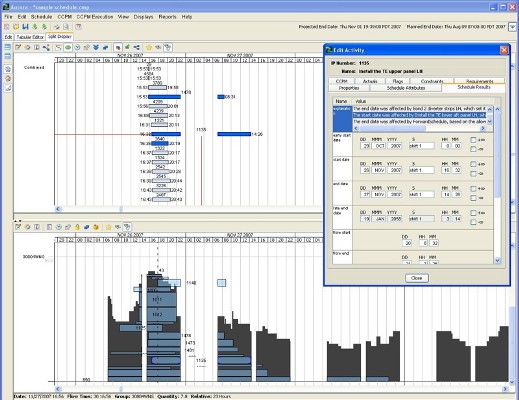
Split View: Gantt Chart and Histogram
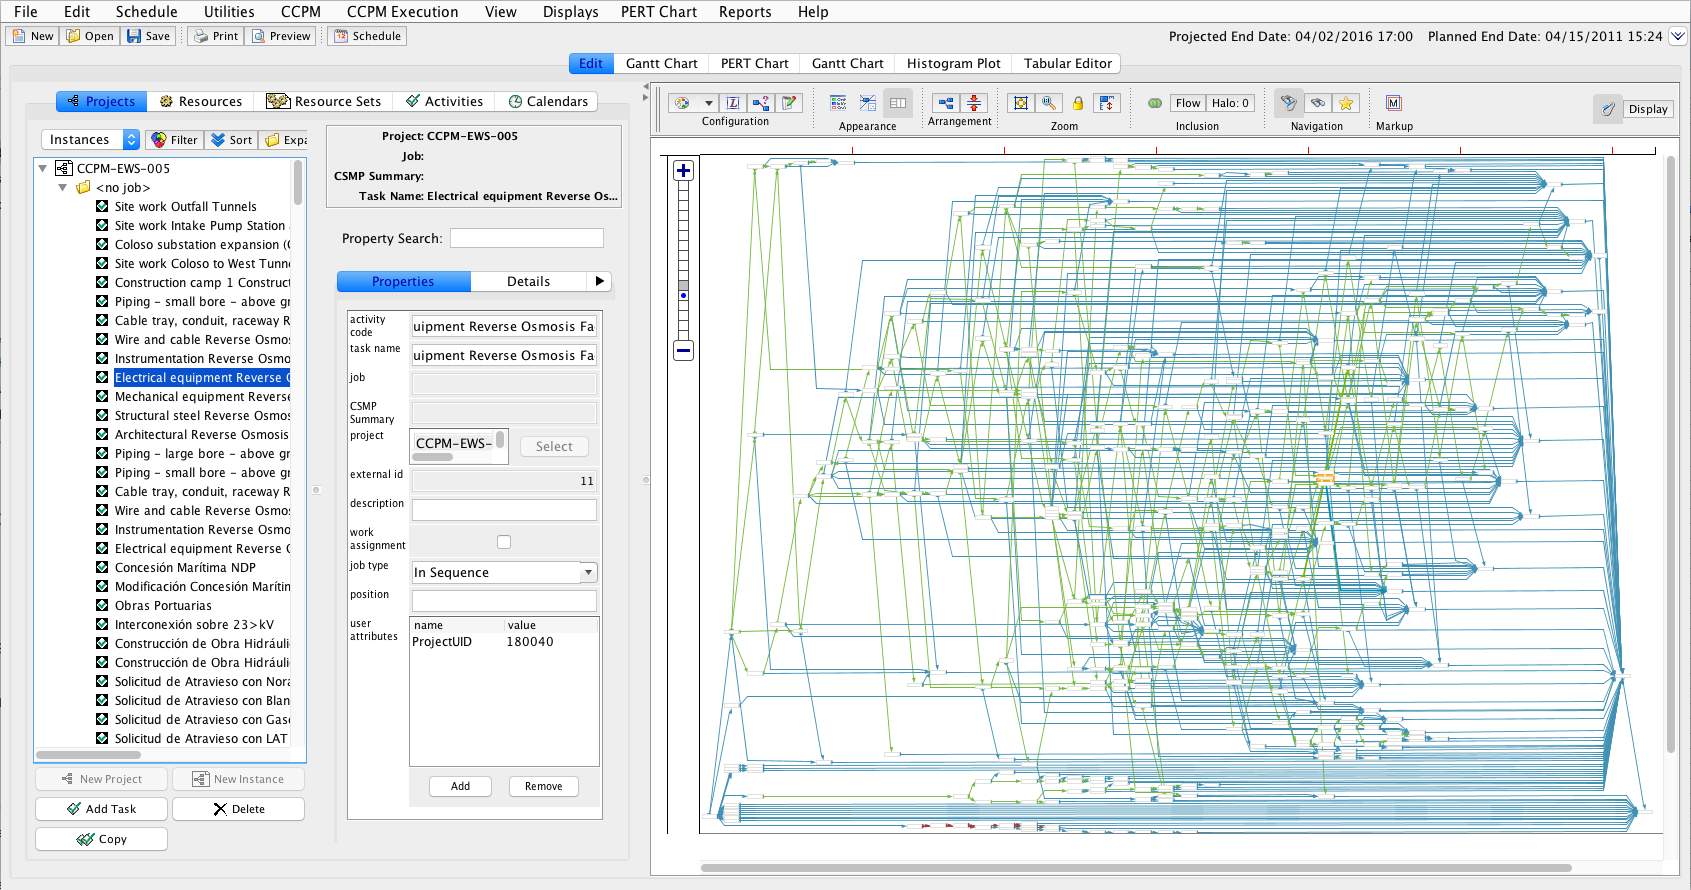
Main Display running on Mac
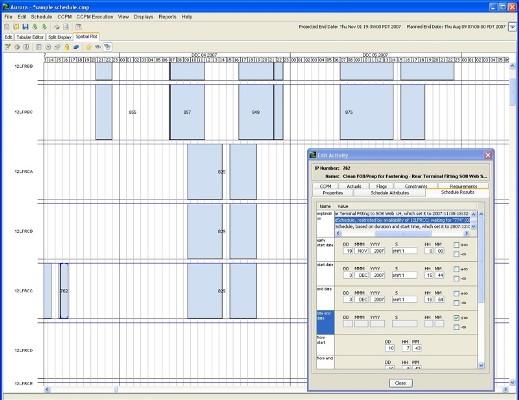
Spatial Plot
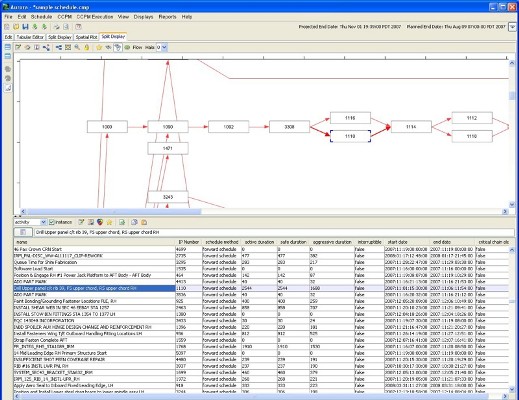
Split View: Network Diagram and Tabular Editor

Multi-Project Histogram
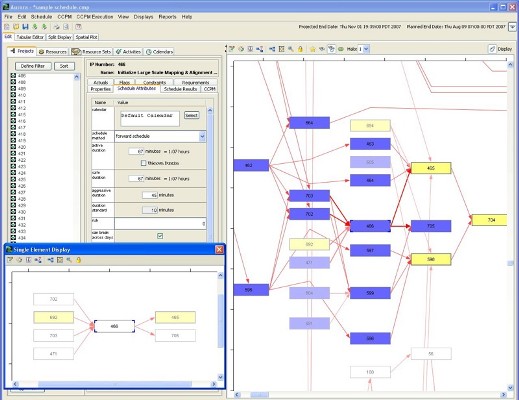
Single Element Display
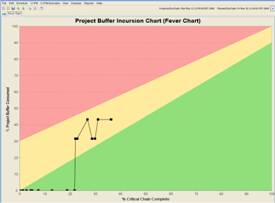
Fever Chart
Personnel with activities delayed by resource contention in blue
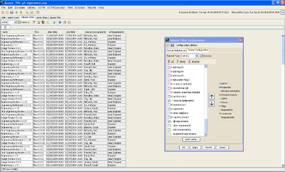
Tabular Editor showing schedule results

Interactive GUI

Project Progress Chart

Project Buffer Incursion Chart (Fever Chart)