
Screenshots
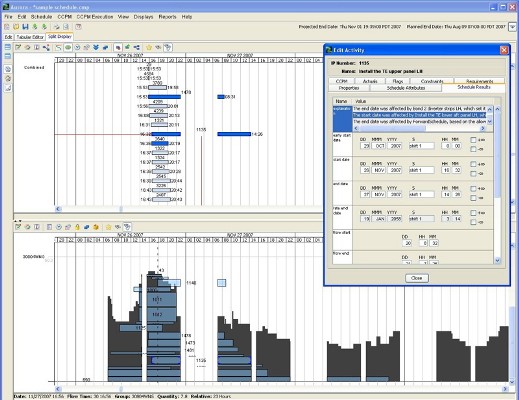
Split View: Gantt Chart and Histogram

Network Diagram with color coding based on criteria
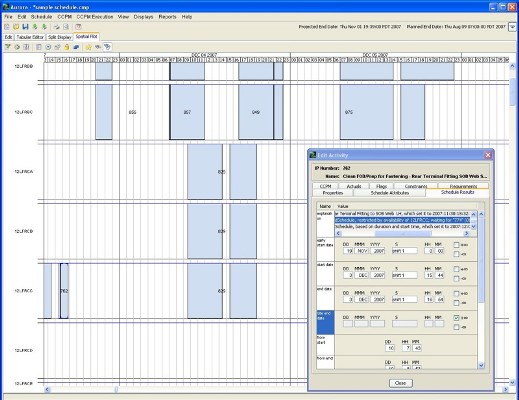
Spatial Plot
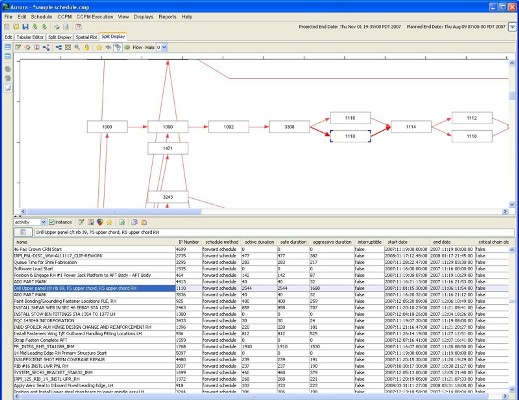
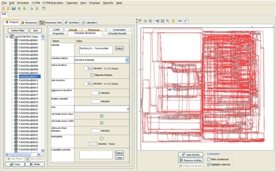
Split View: Network Diagram and Tabular Editor
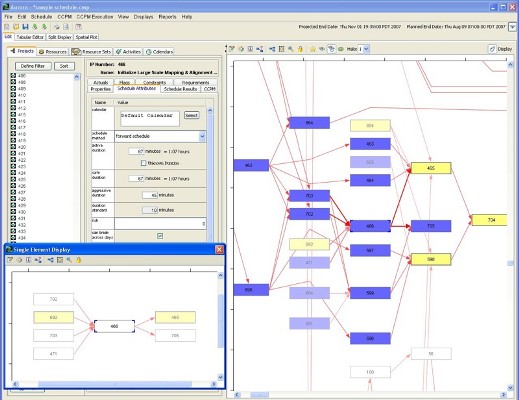
Single Element Display
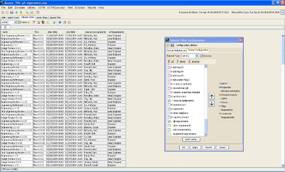
Tabular Editor showing schedule results
Interactive GUI
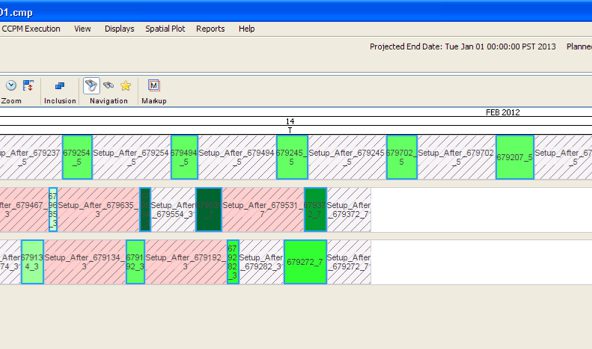

Production schedule with graphical distinction of setup vs production